Build-to-Rent 2026:
The Durable Thesis
Why Midwest Low-Density Is the Next Chapter for Disciplined Capital
The asset class didn’t deteriorate — it re-sorted
National BTR rent growth sat near zero through year-end 2025. But occupancy held in the mid-90s, demand remains structural, and the performance gap between well-located, well-operated communities and the rest of the field is widening materially. The story isn’t deterioration. It’s selectivity.
As the sector matures, the gap between average and superior outcomes reflects geographic selection, product format, and operator capability more than asset-class exposure. The investors who recognize this first will compound the advantage for the next decade.
“BTR has entered its selectivity phase. Geography, product format, and operator execution now matter more than asset-class exposure. Investors who recognize this early will compound the advantage for the next decade.”
The durable allocation is defined by three choices
This paper argues that the durable BTR allocation for 2026 and beyond is defined by three choices. Executed with discipline, this combination delivers inflation-aligned cash flow, operational predictability, and after-tax returns that have become difficult to source elsewhere in real estate.
Midwest & supply-constrained markets
Over oversupplied Sun Belt metros, where rent growth is already diverging in favor of measured-pipeline geographies.
Low-density with private yards
Over dense infill, delivering substantially lower turnover and sustained 10–20% rent premiums over comparable multifamily.
Disciplined, long-duration capital
Aligned to the BTR development cycle, structured for the operational predictability and tax efficiency family office portfolios require.
Demand is structural, not cyclical
36% of BTR residents identify as renters by choice — not because they can’t afford to buy, but because they prefer the product. This behavioral shift has outlasted the 2022–2024 rate cycle and shows no sign of reverting. Only 8% of single-family renters define the American Dream as homeownership. (John Burns Research & Consulting, 2024)
A national housing shortfall exceeding 4 million units (Realtor.com, 2026), a typical household now requiring approximately $113,000 in annual income to afford a median-priced home (Bankrate, 2025), and renting being cheaper than owning in all 100 of the largest U.S. metros (LendingTree, 2026) — these are not cyclical phenomena. Purpose-built BTR is the only product format delivering single-family living at scale to renters who prefer it.
The Midwest is already outperforming — and the gap is widening
Through 2025, Midwest BTR blended rent growth ran in the mid-single-digit range year-over-year, while high-delivery Sun Belt markets contracted by low-single-digits over the same period. By year-end 2025, Yardi Matrix data showed continued positive rent growth across the Twin Cities, Chicago, Columbus, Indianapolis, Kansas City, and Milwaukee, even as the national SFR/BTR index moved into modestly negative territory.
The Midwest is not absorbing a supply overhang because it never built one. As of early 2026, the Midwest represented approximately 13% of national BTR units under construction. Phoenix alone has a pipeline that effectively matches the entire Midwest combined. (RealPage Market Analytics)
| Market | 2024 (Actual) | 2025 (Observed) | 2026 (Directional) | 2027 (Directional) |
|---|---|---|---|---|
| Midwest BTR | ~3.8% | +3–5% range | 3.5–4.5% | 3.5–4.0% |
| BTR (Purpose-Built) | 3.0% | ~0% | ~2.5% | ~3.0% |
| National Multifamily | 2.9% | –0.6% | ~0.5% | ~1.0% |
Sources: 2024 actuals from RealPage, Yardi Matrix, Harvard JCHS, and John Burns Research & Consulting. 2025 figures reflect directionally observed full-year ranges. Forward 2026–2027 figures are directional and illustrative; actual outcomes will vary by submarket and operator.
Low-density format is the product that compounds
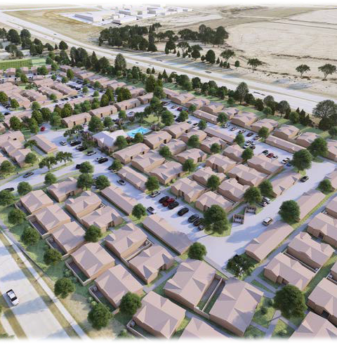
Within BTR, the low-density cottage and detached-home format — roughly 8 to 10 units per acre, with private yards, garages, and community amenities — serves the renter-by-choice cohort and produces the most durable operating economics. Turnover runs 14–18% annually in premium communities versus 20–30% in conventional multifamily. Every percentage point of turnover eliminated falls directly to NOI.
Rent premiums of 10–20% are achievable over comparable multifamily in targeted markets, driven by private yards, amenity utilization, and superior floor plans for families and remote workers. Identical floor plans, single-vendor procurement, and centralized maintenance deliver operating cost advantages that scattered-site strategies structurally cannot match. (RSM US, 2026)
The combination of Midwest geography and low-density product format is the contrarian BTR position in 2026. It accepts lower headline rent growth in exchange for lower volatility, lower turnover, lower operating cost variance, and higher renewal pricing power. For disciplined capital, this presents a meaningfully different risk-adjusted return profile than Sun Belt growth-chasing BTR, and the 2025 data supports the case for geographic selectivity over asset-class exposure alone.
The allocation decision is no longer a simple yes or no
Family offices anchor real estate at 13% of portfolio allocations within a “big three” that includes private equity (28%) and public equity (15%), valued for cash flow and inflation protection. (BNY Wealth, 2025) The question in 2026 is not whether to invest in BTR — it is where, in what product format, and with which operator.
The performance gap in BTR is significant and widening. As the sector matures, the difference between average and superior outcomes reflects geographic selection, product format, and operator capability more than asset-class exposure. Site selection, cost discipline, and lease-up execution are the primary determinants of risk-adjusted return.
Executive Summary
Free · No form required · 2 pages
The full paper covers tax structuring, the January 2026 Executive Order carve-out, a detailed risk framework, operator selection criteria, phased lease-up economics, rent performance analysis, and Cavan’s operational methodology. Available to accredited investors upon request.
✓ Shared only with Cavan Companies. Never sold or distributed to third parties.
For informational purposes only. Not investment, legal, or tax advice. All projections are illustrative. Cavan Companies is an active developer and operator of purpose-built BTR communities; readers should consider this operating interest when evaluating the observations presented. Investors should consult their own qualified advisors before making any investment decision. Under SEC Rule 506(c), all investors must be verified accredited investors.





 +1 (480) 627 7000